In my previous article, I used Bayes’s theorem to ask the question “if the O’s are at or above .500 on July 1, what is the probability they will finish at or above .500?” I found that if the O’s are winning on July 1, they’ll likely finish the season that way; conversely, if the O’s are losing on July 1, they’ll likely finish the season that way. It’s not the most useful question, since predicting whether the O’s will have a winning or losing season isn’t the thing that most people truly care about, but it was a way for me to practice with this methodology and see if there was merit in it. And, as a fan who recently endured 14 losing seasons, I am allowed so simply hope for a winning season 🙂
I sent the article to Tom Tango who provided me with some feedback and another couple avenues of research. Today I want to follow one of those avenue by examining the following class of question:
If, after n games, the Orioles have won m games, what is the probability they will win at least 94 games in the season?
I’m not finished with this research project yet, but I want to share what I have done so far.
Methodology
To do this study, first I converted all seasons to 162-game equivalents, since that’s what we care about today. The (current) O’s have been around since 1954, when the season was 154 games, plus they played in a few strike-shortened seasons (1972, 1981, 1994, 1995) and a few years they played only 161 games.
Then for each season, first I assessed whether they won at least 94 games that season. Easy enough 😉 Then I examined mid-season records for the Orioles at six points: after 27 games, 54 games, 81 games, 108 games, 135 games, and (of course) 162 games. These points each correspond to one-sixth of each season and fall roughly on the end-of-month boundary marks for April, May, June, July, August, and (of course) September. (For shorter seasons, I adjusted the measuring points accordingly.)
At each point I noted how many wins the Orioles had. Then I computed the following variables:
- x: the Orioles’s probability of winning at least 94 games in a season. They’ve done this 15 times in 60 seasons, giving me a prior estimate of 0.25.
- y: the probability of the Orioles having m wins after n games, given that they will win at least 94 games.
- z: the probability of the Orioles having m wins after n games, given that they will not win at least 94 games.
Then I used Bayes’s theorem to calculate the posterior probability for each n game / m win combination. Thank goodness for spreadsheets.
For what it’s worth, I chose to examine the 94-win threshold because that’s the average amount of games the AL Wild Card winners (or, in the past two years, Coin Flip Game participants) have won (again accounting for the strike-shortened season of 1995). If you win that many games you’ve had a damn fine season and have a good shot at making the playoffs. So the 94-win proxy is really a threshold for “making the playoffs” via any fashion, without accounting for the fact that you have to actually win the Coin Flip Game in order to advance.
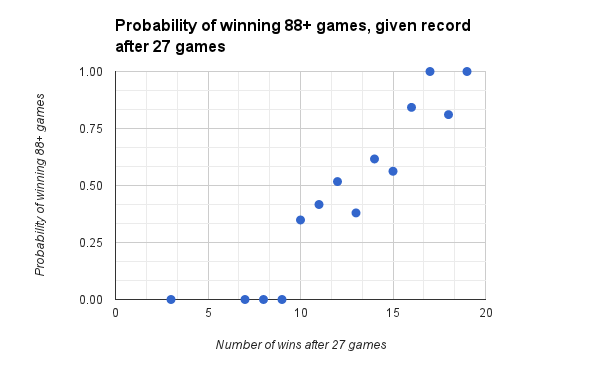
Preliminary Results at the 27 Game Mark
To start, let’s look at the results from my measurements at the 27-game mark:
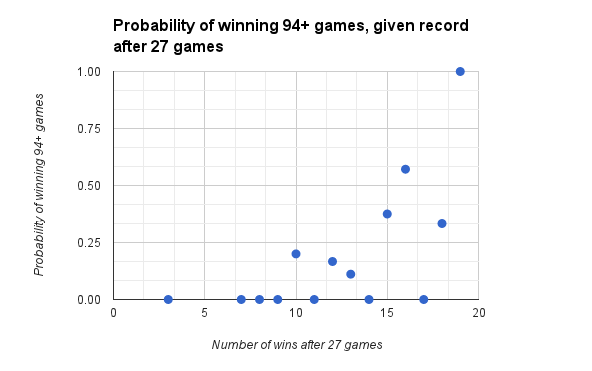
You say you’ve started the season 10-17? Well fear not, you still have a non-zero shot at 94 wins, as the 1982 Orioles prove to you 🙂 They ended up finishing 94-68. It can happen to you, too!
Other than that little surprise, it makes sense that if you start the season under .500, your probability of winning 94+ games is fairly low; the further you get over .500, your probability obviously rises.
There are some other surprises, like the probability at 16 games being over .50 but 0 at 17 games, and the probability being 1 at 19 games. These are symptomatic of problems in the dataset & methodology that I will discuss below.
Discussing the Results
There are two main problems with the results:
- Lack of data. I used the O’s existing records to record my inputs. Since Bayes’s theorem knows nothing except what I tell it, it can’t estimate what’ll happen when the O’s have 4 wins at the 27-game mark, because that’s never happened. It spits out a 0 (technically, a DIV/0 error 😉 which is why there are several blank spots on the graph.
- Too much certainty. Given the data I used, the theorem returns many absolutes, resulting in posterior probabilities of 0 (will never happen) or 1 (will always happen). For example, the O’s have reached 19 wins by the 27th game three times: 1969, 1970, and 1997. Each time, they’ve won 94+ games (109, 108, and 98 respectively). There is no evidence of them reaching the 19-win mark this soon and then failing to win 94 games, so the theorem estimates a 100% chance they will win 94 games.This of course is not representative of reality. Even if a team starts off 19-8, all sorts of things can happen that will disrupt their chances of winning at least 94 games. Just because it hasn’t happened to the O’s yet, doesn’t mean it can’t happen. I haven’t done the research yet but I suspect it has happened to at least one team in history, meaning it could happen to the Orioles. The only time you can be 100% certain of winning 94 games is if you actually win 94 games ;-)The “too much certainty” issue also comes in to play at the 17-win mark. The O’s have started the season 17-10 only once, in 1994. They’d end up winning a 162-game equivalent of 91 games, which is short of the 94-win threshold. Thus this formula rates their chances of hitting that threshold at 0. However, again, the formula only knows what I tell it. And a 91-win season is fairly close to a 94-win season, so I believe the team’s chances of hitting 94 wins is more than zero.
Anyway, it doesn’t make sense that you can win 17 games and yet have a lower probability of winning 94 than you’d have if you’d won 16 games. I would believe that only if no team had ever done it, and I don’t have the data to prove that.
I have a couple thoughts on how to rectify these issues:
- Look at how all AL teams, or maybe just teams in the AL East, performed at, and after, the 27-game mark. This will provide me with some more data, but then I won’t be able to say that the results apply strictly to the O’s.
- Make up sensible numbers and see what other people think about them 🙂 Maybe I will poll the writers at Camden Chat, haha.
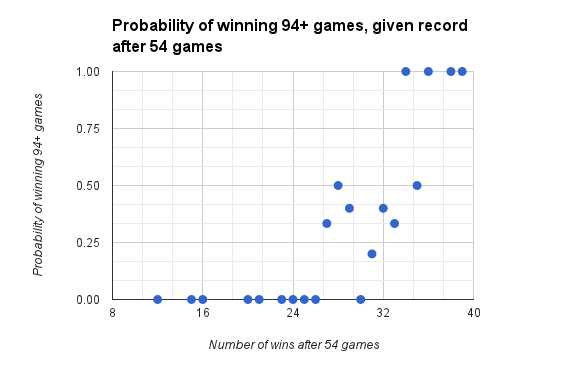
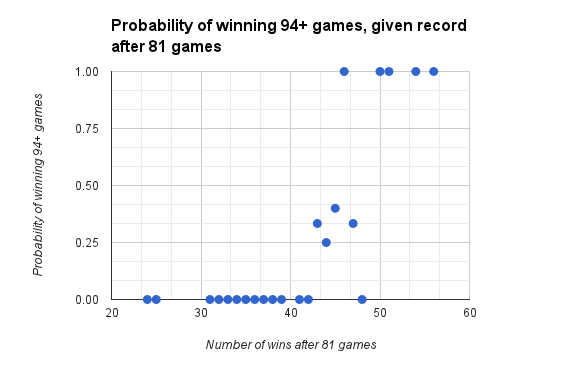
What About after 54, 81, 108, and 135 games?
Despite the research needed, I thought including data from the other five measuring points would be instructive.
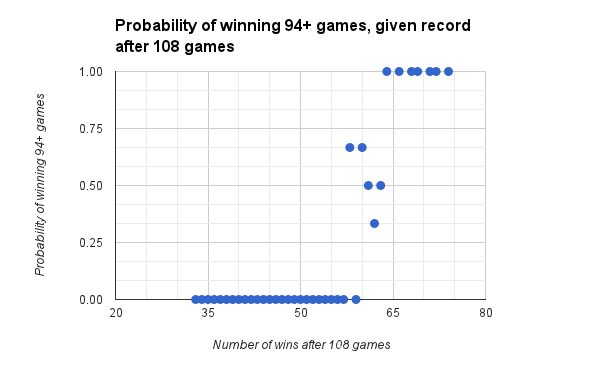
After 108 games, if you have not won at least 40 games, winning 94 will be impossible.
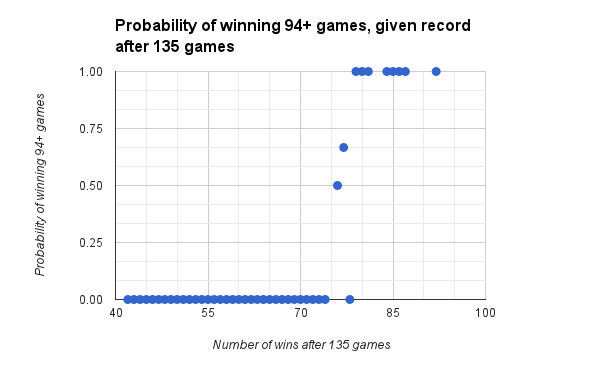
After 135 games, if you haven’t won at least 67 games, winning 94 will be impossible.
One More for the Road
Before I go, what happens if we lower the threshold to 88+ games?
Here we see that winning 88+ games is easier than winning 94+ games (betcha didn’t need a long blog post to tell you that!). And, although I just got through saying that I need to do more research, it seems there’s a chance that the O’s record after the 27th game can tell us a something useful about how they will fare in the rest of the season.
More to come!