By both traditional and modern metrics, Clayton Kershaw is having another dominant season. Prior to his start yesterday, his 2.20 ERA and 2.83 xFIP led qualified NL starters, and his 2.4 fWAR was second only to Max Scherzer‘s. He’s in the conversation for the NL Cy Young yet again, as he is nearly every year.
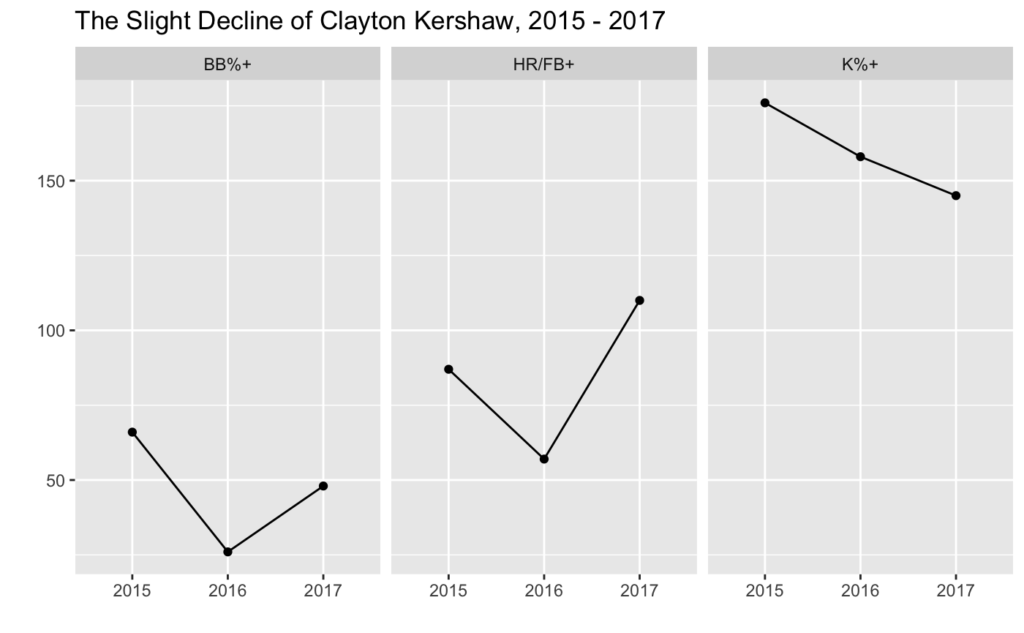
But some cracks are showing in his armor. Year-to-year, Kershaw’s walks are up and his strikeouts are down. He’s also allowing more fly balls and more home runs per fly ball than last year, leading to an increase in HR/FB%, even more so than what you’d expect given the league-wide rise in home runs:
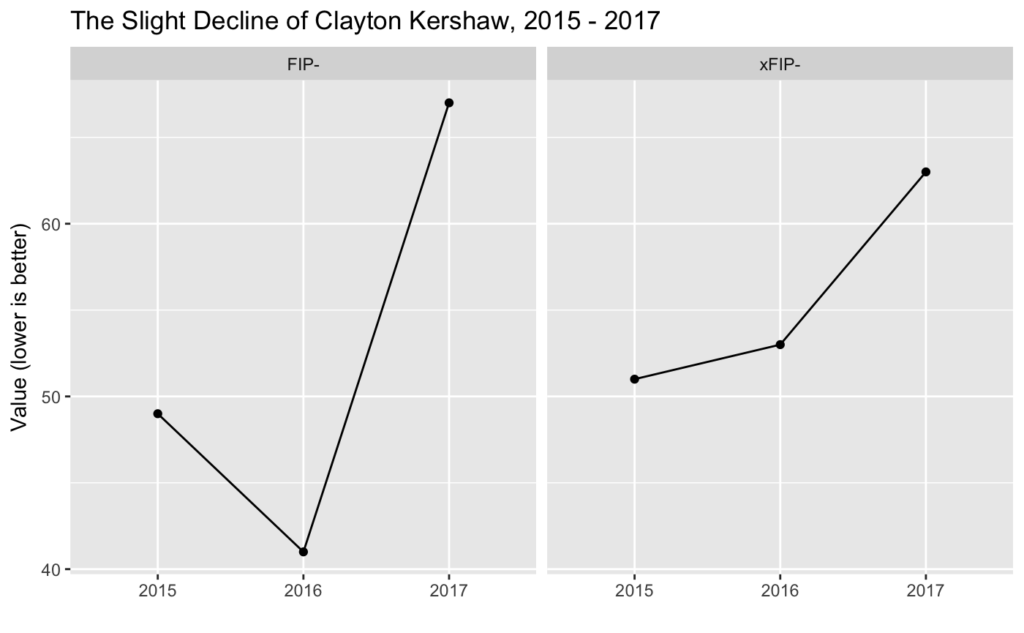
As you’d expect, Kershaw’s FIP- and xFIP- are worse than last year. The following graphs compare him to starters who faced at least 200 batters in each of 2015 and 2016 and at least 67 batters this year:
What’s going wrong? FanGraphs includes in its dataset linear weights for each pitch type, where a higher value indicates the pitcher is suppressing more runs with that pitch than average. When computed on a per-100-pitches basis, this data can isolate which pitches are driving a pitcher’s change in performance.
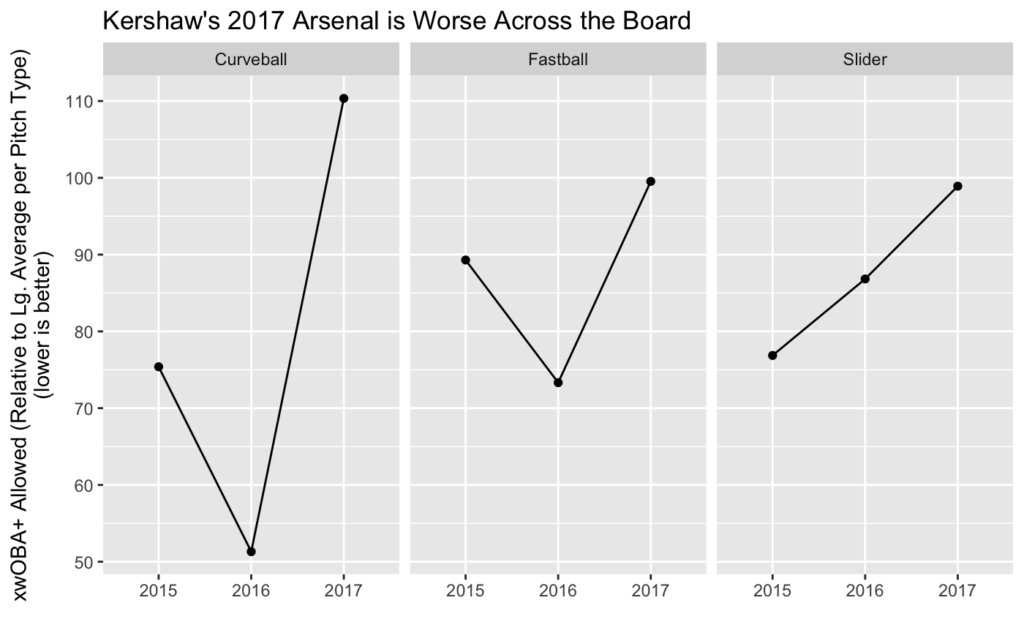
The following graph of Kershaw’s primary arsenal shows that while his curveball is better than in years past, his fastball and slider are worse:
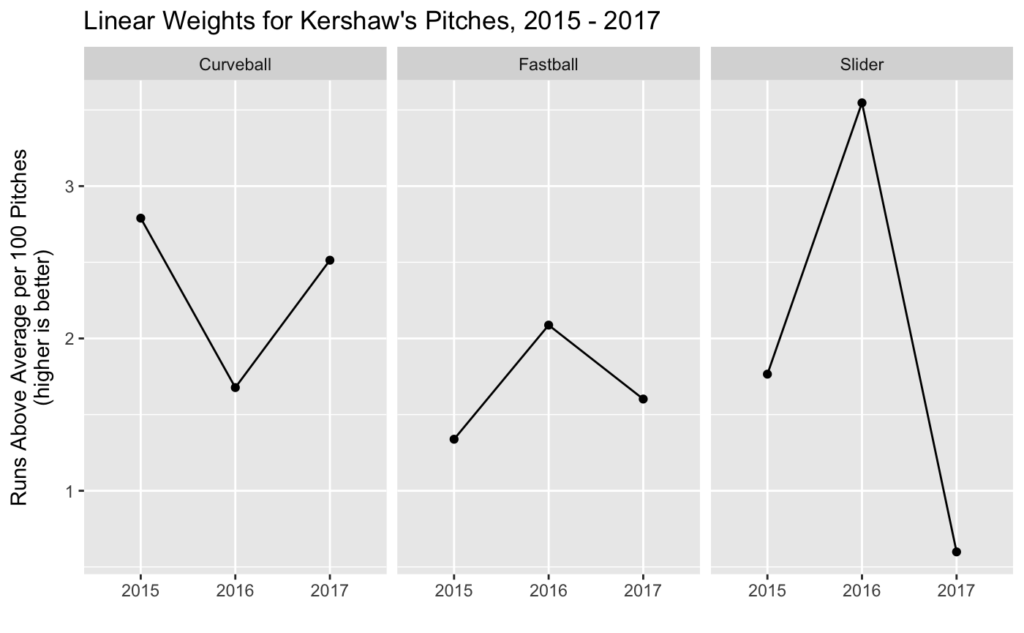
According to this analysis, his slider is driving his (admittedly slight) decline. Are we ready to send Dodgers’ pitching coach Rick Honeycutt out to the mound?
But we can go deeper. Pitch type linear weights take into account whether the pitch was thrown for a strike or a ball, the count into which the plate appearance moved after the pitch was thrown, and any results (single, home run, etc.) of the pitch. It’s the latter portion — the results of each pitch — that drive the majority of the run values. This analysis is useful but relies on factors outside the pitcher’s control, primarily the quality of their defense and the positioning of the fielders.
That’s where xwOBA comes in. xwOBA, as measured by Statcast, uses launch speed (also known as exit velocity) and launch angle to compute the expected wOBA of a batted ball. By relying on these two characteristics, xwOBA ignores defense, weather, and other elements that neither a batter nor a pitcher can control. Thus xwOBA gets at a more meaningful question than linear weights results: what’s the quality of contact?
To dig deeper into Kershaw’s 2017 season, I pulled xwOBA data for all starters with at least 200 batters in both 2015 and 2016 and at least 67 batters in 2017. I then modified the dataset to add .69 xwOBA for each walk and .72 xwOBA for each hit-by-pitch (by default, Statcast reports these events as worth 0 xwOBA, which is inaccurate for my purposes here). I then computed the mean xwOBA allowed for each pitch type in each season and indexed it to 100.
The result is xwOBA+ Allowed and it functions as a complete measure of quality-of-contact, with walks and strikeouts accounted for. These results are independent of a team’s defense, the weather that day, or any league-wide trends in offense. xwOBA+ Allowed paints a different picture of Kershaw’s arsenal than linear weights analysis does:
Note that in the graph above:
- xwOBA+ Allowed is computed relative to all other pitches of the same type.
- Lower values are better. (This contrasts with the linear weights graph, where higher values were better.)
The graph above, based on xwOBA+ Allowed, shows us Kershaw’s curveball isn’t better than last year’s. It’s worse. Whereas in 2016 hitters’ mean xwOBA on Kershaw’s hook was a startling 50% of league average, in 2017 hitters’ mean xwOBA on the pitch is 110% of league average.
The graph also confirms that Kershaw’s fastball and slider are indeed worse than in 2016. But it’s his curveball, not his slider, that’s dragging him down a bit in 2017. Okay Rick … now you can go talk to your starter.
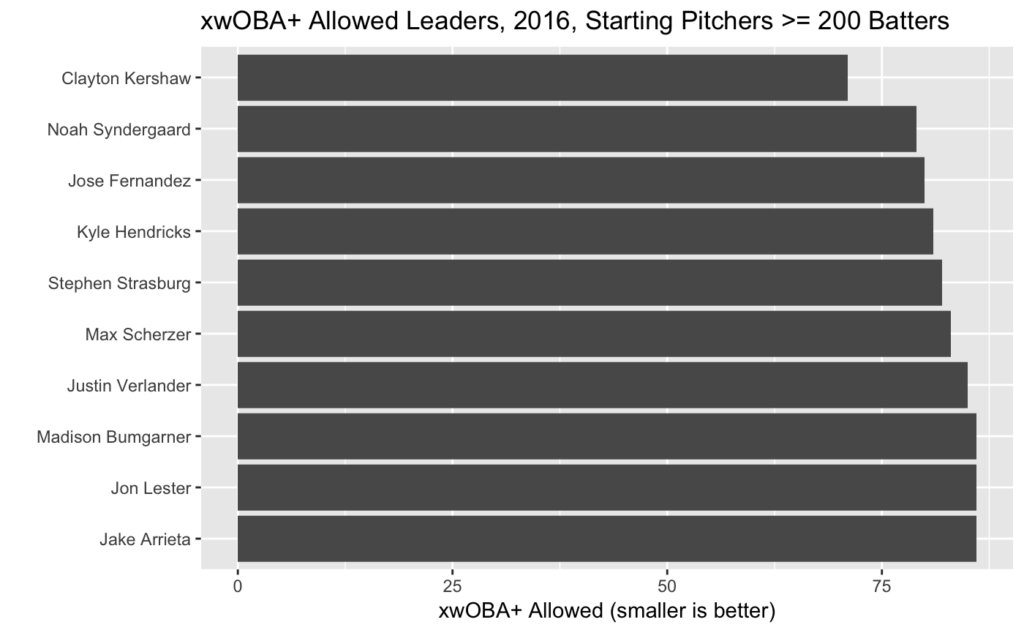
xwOBA can tell us more. In 2016, Kershaw’s xwOBA+ Allowed of 71 led MLB starters who faced at least 200 batters:
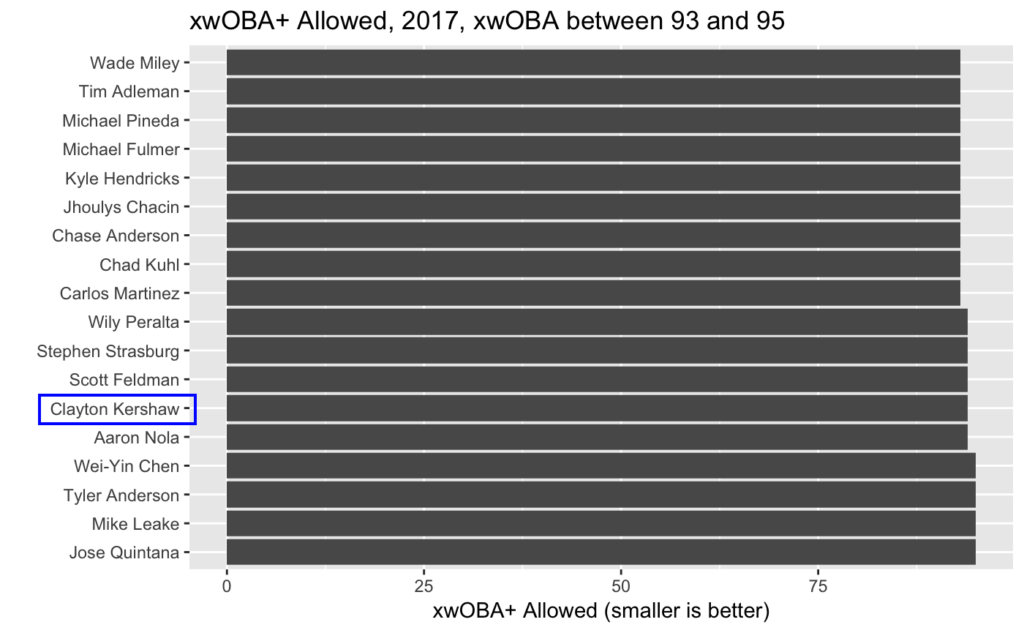
But this year, when compared to starters who’ve faced at least 67 batters, Kershaw’s xwOBA+ allowed is a more pedestrian 94. He’s dropped from the 100th percentile to the 70th, from peers such as Max Scherzer to peers such as Scott Feldman and Aaron Nola. Fine pitchers to be sure, but not whom you think of when you think of “guys similar to the best pitcher alive”:
When you’re at the top, you’ve got a long way to fall. Kershaw nearly tops the list of starting pitchers who are allowing worse contact, striking out fewer batters, and/or walking more batters this year than last:
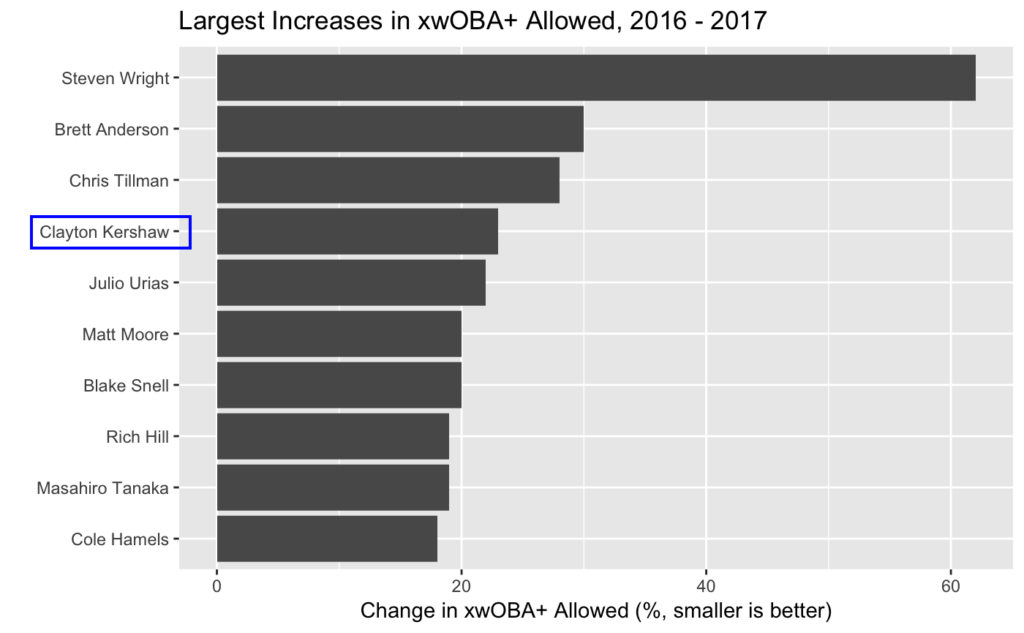
In 2017, these are not names you want to be associated with. Brett Anderson struggled mightily in Chicago and was DFA’d. Chris Tillman‘s season is a mess. Steven Wright and Cole Hamels labored to find their stuff before hitting the DL. Masahiro Tanaka has a 5.46 FIP and recently skipped a turn in the Yankees’ rotation. Matt Moore has a 4.88 FIP and Blake Snell‘s FIP is an unsightly 5.13.
Is Clayton Kershaw toast? Hardly. Kershaw’s placement on the list above is partly a function of his place atop the xwOBA+ Allowed leaderboard a year ago. He literally could not get any better relative to the league, so seeing him fall by some amount isn’t surprising. Further, a slightly-worse Clayton Kershaw is still someone I’d want on the mound in an elimination game. His base talent level is so high, he can lose some of his shine and still lead FanGraphs’ WAR leaderboards.
But those leaderboards don’t account for the fact that batters are making better contact against all of Kershaw’s primary pitches than they were last year. Perhaps this is why Kershaw continues to tweak his delivery. Baseball is a game of adjustments; xwOBA helps us see when and where they need to be made.
Featured image taken by Keith Allison; licensed via CC BY-SA 2.0.