Mike Moustakas is among many hitters taking advantage of the harder baseballs with lower seams that are fueling record-breaking home run totals. Moustakas (or “Moose” as fans affectionately call him) is hitting .270/.306/.547 with a a park-adjusted offense that’s 17% better than the average major-leaguer. But more to the point, the Kansas City Royals’ third baseman has hit 22 home runs in 307 plate appearances, not only equaling his career high for an entire season (set in 2015), but also putting him among the league leaders in long balls this year.
From here on out every home run will set a new personal best for him. But now fans are starting to wonder: can he set a new team best? Steve Balboni holds the Royals’ franchise record for home runs in a season. In 1985 he hit 36 big flies for the team, who won the World Series that year.
No Royal since has matched or surpassed him, not even during the offensive boom of the late 1990’s and early 2000’s. Gary Gaetti came the closest; in 1995 he smacked 35 round-trippers. But since him the best the team could muster was Dean Palmer‘s 34 in 1998 and Jermaine Dye‘s 33 in 2000.
If you read my post on Aaron Judge, you know what I’m going to do here. To accurately forecast Moustakas’ home run total, we need to understand his true HR/PA rate. Right now it stands at .071, or 7.1 home runs for every 100 PA. Can he sustain this rate going forward?
Probably not. Such a rate is very rare for a left-handed hitter. To show you how rare, I’ve drawn a line, in powder blue for you Royals fans, at .071 over a histogram of player-seasons by left-handed batters since 2015 with at least 80 PA in a season:
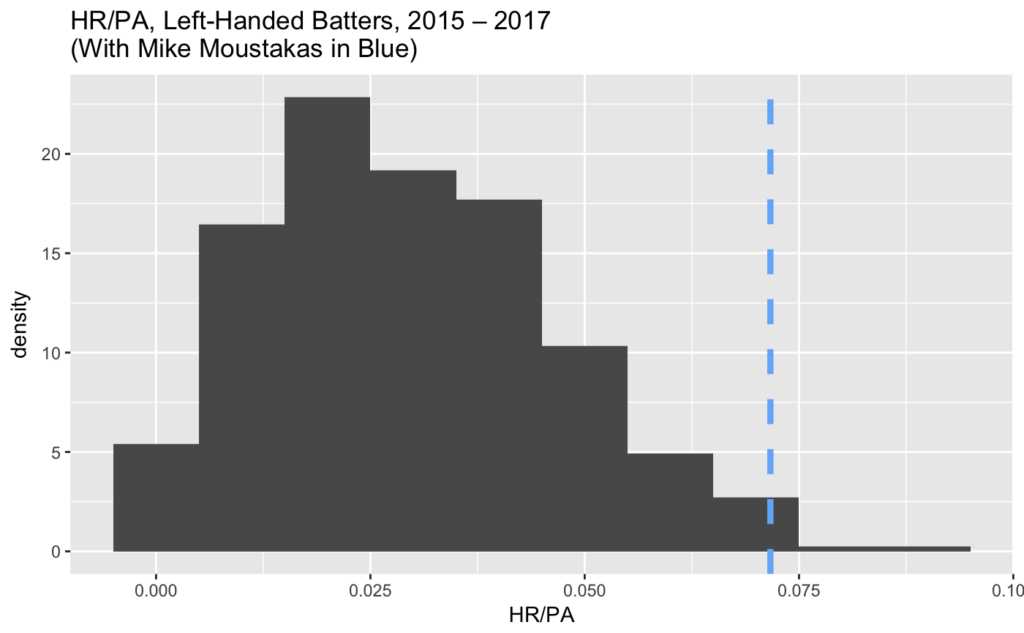
Extrapolating this rate forward ignores the low probability of any left-handed hitter sustaining a .071 HR/PA rate. As you can see above, it’s possible, but not probable, that a left-handed hitter can do this.
As I showed with Aaron Judge, the best approach is to handle this with probability distributions, which allow us to express a degree of (un)certainty over an entire range of possibilities, like so:
- Express our prior beliefs about Moustakas’ HR/PA rate as a probability distribution
- Combine this distribution with what we’ve seen Moustakas do on the field
- See what the resulting (posterior) probability distribution says about Moustakas’ true HR/PA rate
Step-by-step:
Define Prior Expectations
The histogram above shows you what our prior beliefs about Moustakas’ HR/PA rate should be. I’ll add a probability distribution so you can see it:
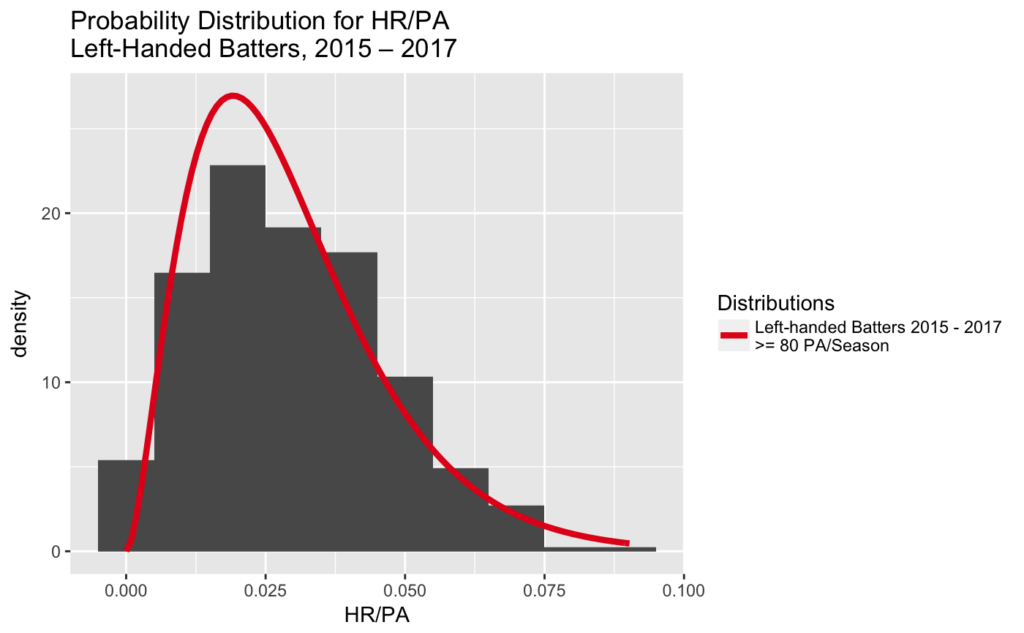
If we knew nothing else about Moustakas, we’d expect him to have a .019 HR/PA rate. That’s where the distribution peaks. But of course, we know more about him!
Observe Moustakas’ HR/PA Rate
As we know, Moustakas has hit 22 HR in 307 PA this year. Simple!
Combine Prior Expectations with Observations
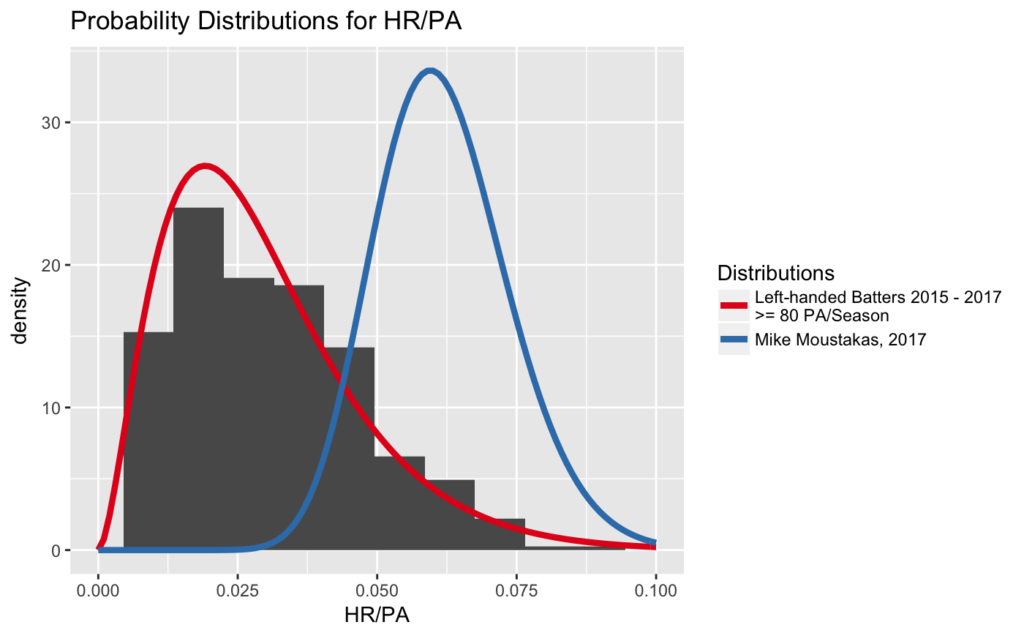
The blue curve shows the probability distribution of Moustakas’ true HR/PA rate, after accounting for both our prior expectations and our on-field observations. Eyeballing the curve, it seems Moustakas’ HR/PA rate lies in between about .03 and .099, peaking somewhere around .057. But we don’t have to eyeball it.
The Results
To understand this distribution more precisely, we can simulate 10,000 Moustakas seasons and examine the resulting distribution. We’ll look at the following pieces of information:
- The 95% credible interval of the distribution is a range of HR/PA values such that we’re 95% certain the true HR/PA rate lies somewhere in between.
- The expected value of the distribution is the most frequently occurring value. It’s the HR/PA rate we’d expect Moustakas to exhibit going forward, after mixing both prior expectations and on-field performance.
After we simulate these seasons, the probability distribution of Moustakas’ HR/PA rates looks like the following graph (shown again in powder blue for your viewing pleasure):
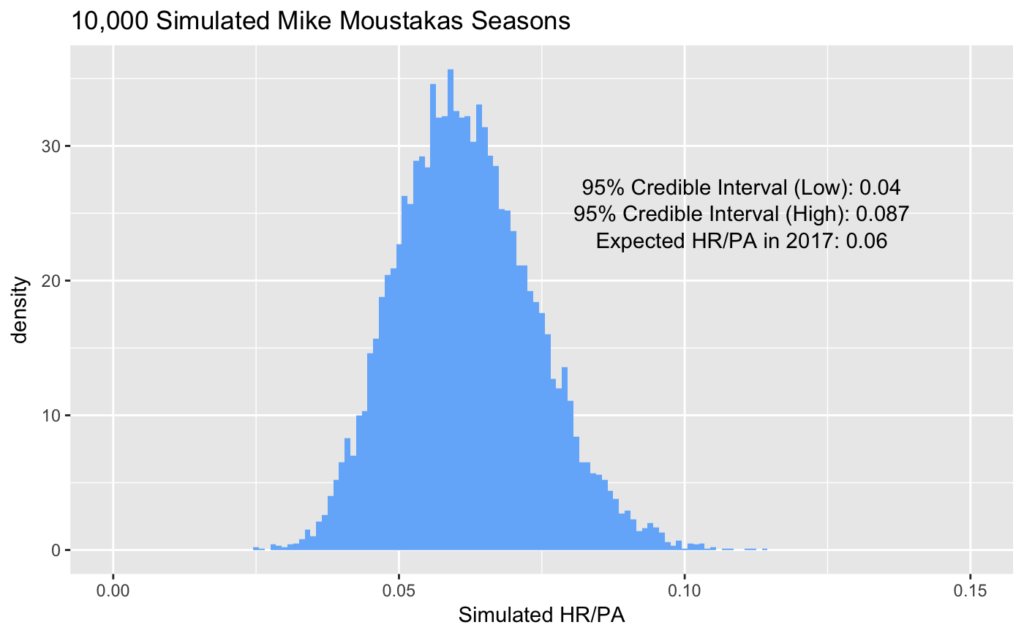
- The “low” value of .04 and “high” value of .087 mean:
- We’re 95% certain Moustakas’ true HR/PA rate lies in between .04 HR/PA and .087 HR/PA
- We’re 2.5% certain Moustakas’ HR/PA rate is less than .04 HR/PA
- We’re 2.5% certain Moustakas’ HR/PA rate is greater than .087 HR/PA
- The expected value gives us the answer we’re looking for: his true HR/PA rate is most likely .06, or 6 home runs every 100 PA. Given this rate, we can understand that his current .071 HR/PA rate is somewhat lucky. But every baseball performance contains some luck — which is why speaking in terms of probability distributions is so useful!
Anyway, with the .06 HR/PA rate in hand, calculating when Moustakas will reach 37 HR and set a new Royals franchise record is straightforward:
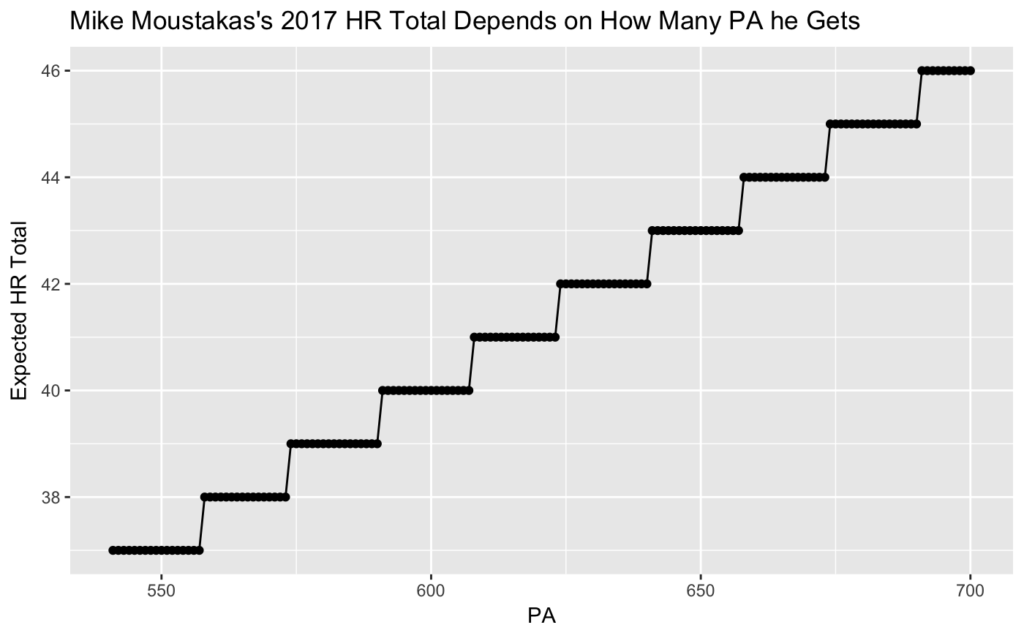
Moustakas should break the record sometime around his 541st plate appearance. Barring injury, he’ll reach this threshold easily: a typical full season is about 650 plate appearances. If Moustakas reaches that number, he should produce between 42 and 43 home runs. With any more plate appearances than that he’ll likely double his previous career high in home runs.
Therefore, we can confidently project that Moustakas will set a new Royals single-season home run record this year. So, sorry, Mr. Balboni: you’ve had a nice run at the top of the Royals’ leaderboards. I hope you’ve enjoyed your 30 years in the limelight. Wave goodbye, because Mike Moustakas will likely take your single-season home run crown before the 2017 season is over.
(Photo by Keith Allison)