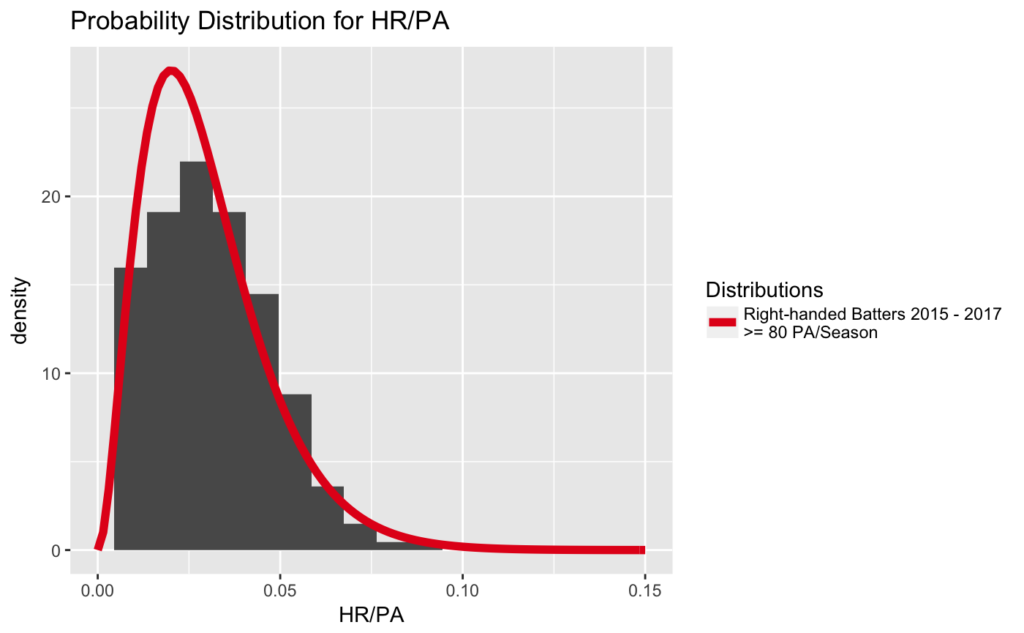
When I last wrote about Aaron Judge, he’d hit 23 home runs in his first 283 plate appearances. The world was his oyster; he was leading the league in home runs for a first-place Yankees team that had shocked baseball by contending when they weren’t supposed to.
I used non-traditional statistical methods to show that we shouldn’t predict Judge’s home run total to be simply an extrapolation of his (then-)current .081 HR/PA rate. That kind of rate, I claimed, was a mixture of talent and luck. I used Bayesian analysis to show that Judge was probably a true-talent .064 HR/PA hitter. Given that rate, in a typical 650-PA season he might hit 47 HR instead of the 53 many in the media predicted for him.
That was almost two months ago. The hallmark of Bayesian statistics is incorporating new evidence into past predictions. Let’s see if our new evidence, gathered over the past two months, affects our past prediction of his 2017 home run total.
What’s He Done Since Then?
After demolishing the competition in the Home Run Derby and playing in his first All-Star Game, Judge struggled to begin the second half. Through last Wednesday he’d hit just five home runs since the All-Star break and was batting just .167 with 38 strikeouts in that time period.
All told, since I wrote my last article Judge has hit 13 home runs in 210 plate appearances: a HR/PA rate of .061. This rate is very good but it’s a sharp drop from the .081 he exhibited prior to June 20th. Interestingly, .061 is also very close to .064, which was my estimate of his current true talent level.
Does this additional information change my prediction of Judge’s season-ending HR total? Let’s find out.
Does New Information Change the Previous Prediction?
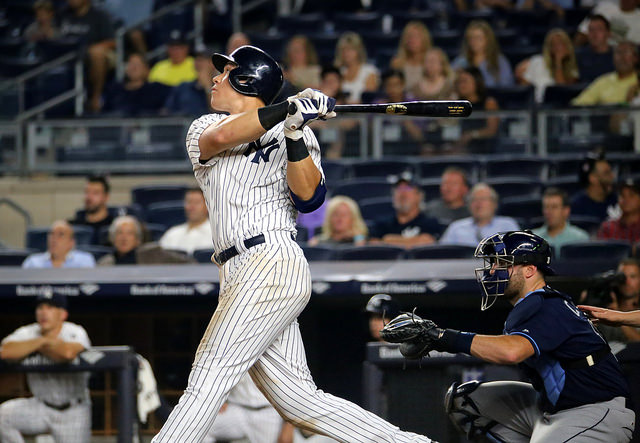
I did change one piece of my methodology. In defining our prior expectations of HR/PA rates for right-handed batters, I used data from 2015 onward instead of from 2010. The reason is that I believe the baseball itself changed materially halfway through 2015, which boosted home run rates.
Still, the prior curve looks similar to the one in my last article:
When I wrote about Judge nearly two months ago, his 23 HR in 210 PA caused his posterior distribution to look like this:
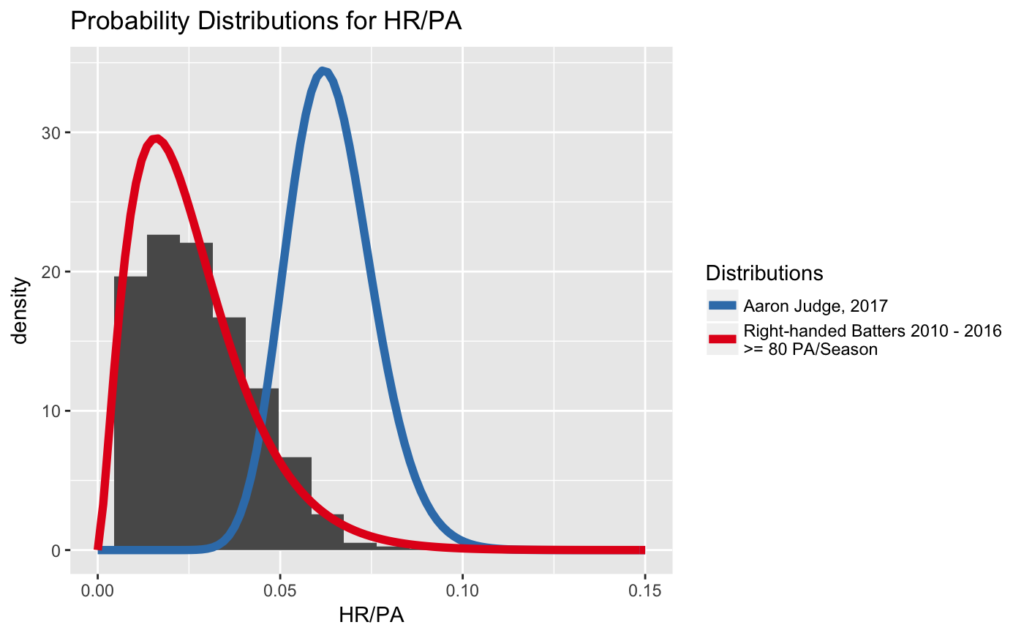
Now we have more information on Judge’s HR/PA talent, given his 36 HR in 493 PA. The new posterior distribution looks like this:
Notice the density’s higher now, peaking near 40 instead of 35, indicating we are more certain about his true HR/PA rate now than we were two months ago. To find out where this new distribution peaks, we can simulate 10,000 draws from it:
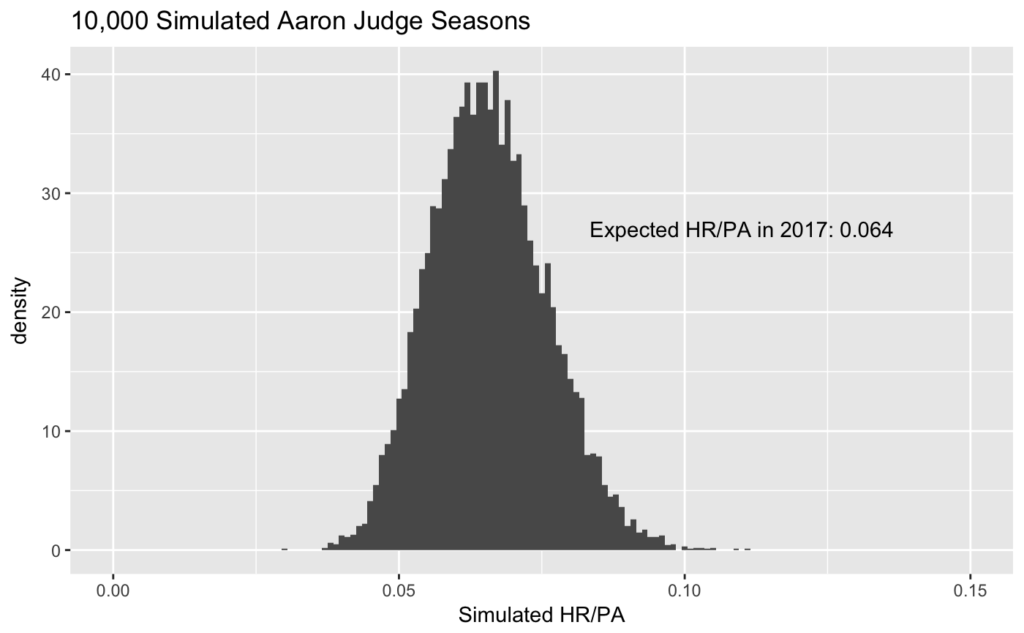
The expected .064 HR/PA rate shown here is exactly the rate I predicted nearly two months and 210 plate appearances ago. The higher density of the curve indicates a higher degree of certainty in this rate. This makes sense; remember, in this time period Judge has shown an HR/PA rate of .061.
As you’d expect, given the same true-talent HR/PA rate, I still predict Judge will hit 47 home runs in a full season of 650 PA:
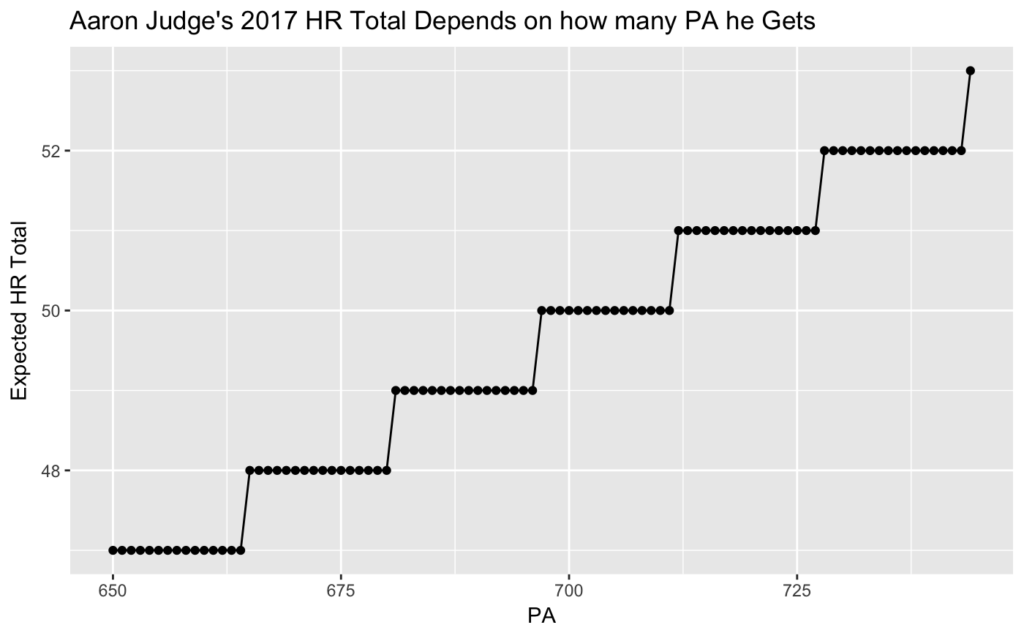
He’ll approach 50 home runs only as he gets near 690 – 700 PA.
This total might’ve seemed low a few months ago when Judge could do no wrong, but his recent struggles show it’s a reasonable prediction. Since then, he’s showed us he’s not the true-talent .081 HR/PA monster he was in late June. Instead, he’s a very good .061 HR/PA slugger. And there’s absolutely nothing wrong with that … unless you’re an Orioles fan like me.