As an Orioles fan it pains me to write this, but New York Yankees wunderkind Aaron Judge is on a tear. His MLB-leading 23 home runs have plenty of folks wondering whether he’ll win the MVP award this year. Having put on a big power display this early in the season, the natural question to ask is: how many home runs will he hit in 2017?
Traditional “on pace” numbers extrapolate current numbers towards the end of the season. Judge has 23 HR in 283 PA, which is .081 home runs per plate appearance. Given a typical 650-PA season, most analysts will tell you Judge is on pace for another 30 long balls, which would give him 53 for the season. This total would be the highest by any batter since Chris Davis in 2013 and the most by any right-handed hitter since Jose Bautista in 2010.
This analysis is flawed because it doesn’t account for one simple fact: Judge’s HR/PA rate incorporates not only his true talent, but also a dose of luck. Simply extrapolating the current rate forward ignores the luck involved.
Think about it this way: in the past seven years there have been 1,736 right-handed batters with at least 80 PA in a season. Judge’s .081 HR/PA rate would be the fourth-highest in this group. Judge is good, but how much money would you bet on him being that extraordinary? Better than 99.8% of right handed hitters in the past seven years? What are the odds of him being that good?
This article will show you how to arrive at a better estimate of Judge’s true HR/PA talent, which we’ll use to forecast a more likely 2017 HR total. What’s more, we can do it despite observing only a few hundred plate appearances of Judge’s performance.
Methodology
These kinds of problems are best approached in the following way:
- Define our prior expectations of Judge’s HR/PA rate
- Observe Judge’s HR/PA rate
- Combine our prior expectations with our observations to arrive at a probability distribution for Judge’s 2017 HR/PA rate going forward
Let’s take it step-by-step.
Define Prior Expectations
I mentioned above that there have been 1,736 player-seasons where right-handed batters have stepped to the plate at least 80 times in a season. The following graph shows the HR/PA distribution of these seasons:
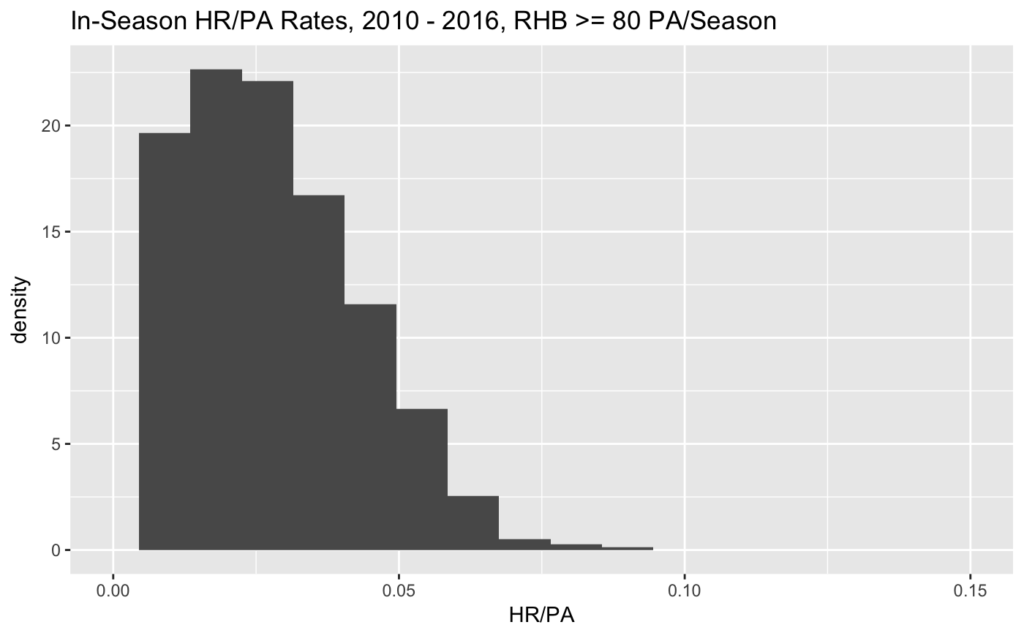
You can see from this graph how much of an outlier a .081 HR/PA rate is. Your conclusion should be: it’s really unlikely that Judge can sustain a .081 HR/PA rate for a full season.
Instead of using a single value from this curve, we can use them all by defining a probability distribution that looks like the following:
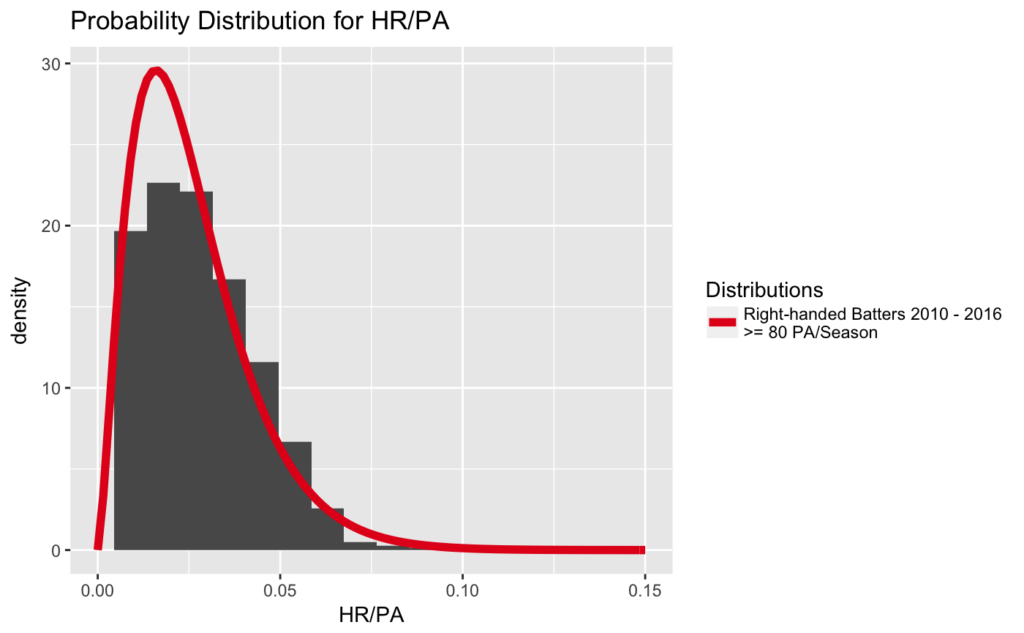
The curve looks like it fits the data nicely, so we’ll use it as our prior expectations of Judge’s HR rate. The expected value of this curve is right around .026 HR/PA, meaning that if we knew nothing else about Aaron Judge, we’d expect him to have that HR/PA rate.
But of course we do know more about him.
Observe Judge’s HR/PA Rate
This one’s easy: as I mentioned above, in 2017 with the Yankees, Judge has hit 23 HR in 283 PA for a HR/PA rate of .081.
We also know he hit four home runs in 95 PA in 2016 for an HR/PA rate of .042. I’ll incorporate this information but reduce its impact by weighting it at 60% of his 2017 data.
Combine Prior Expectations with Observations
Now comes the fun part: just as we defined a probability distribution of our our prior expectations, so too can we define a probability distribution that combines these prior expectations with what we’ve seen from Judge.
The following graph shows not only our prior expectations curve like before, but also Judge’s own curve (in blue):
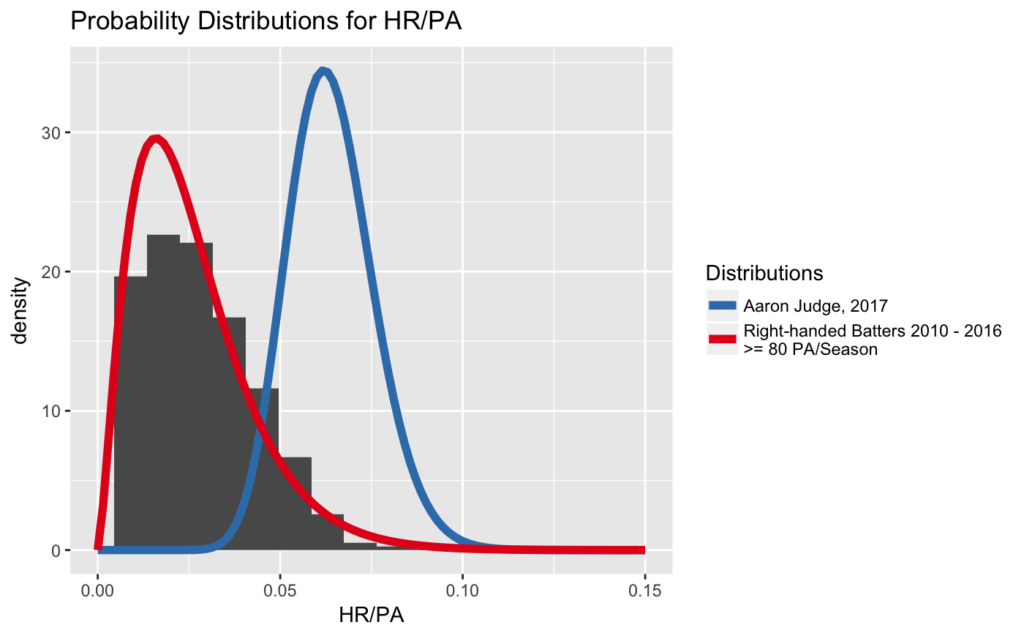
Two things about Judge’s curve:
- It’s further to the right than the red curve, indicating we expect Judge to have a higher HR/PA than your typical major leaguer. This shift to the right matches our expectations of Judge’s power relative to his peers.
- It peaks higher than the red curve, meaning we are more certain about Judge’s probability curve than we are about the one for all right-handed hitters.
To find the expected value of this curve, we can draw 10,000 values from it, essentially simulating 10,000 seasons of Aaron Judge’s HR/PA rate. The following graph shows the results of this simulation:
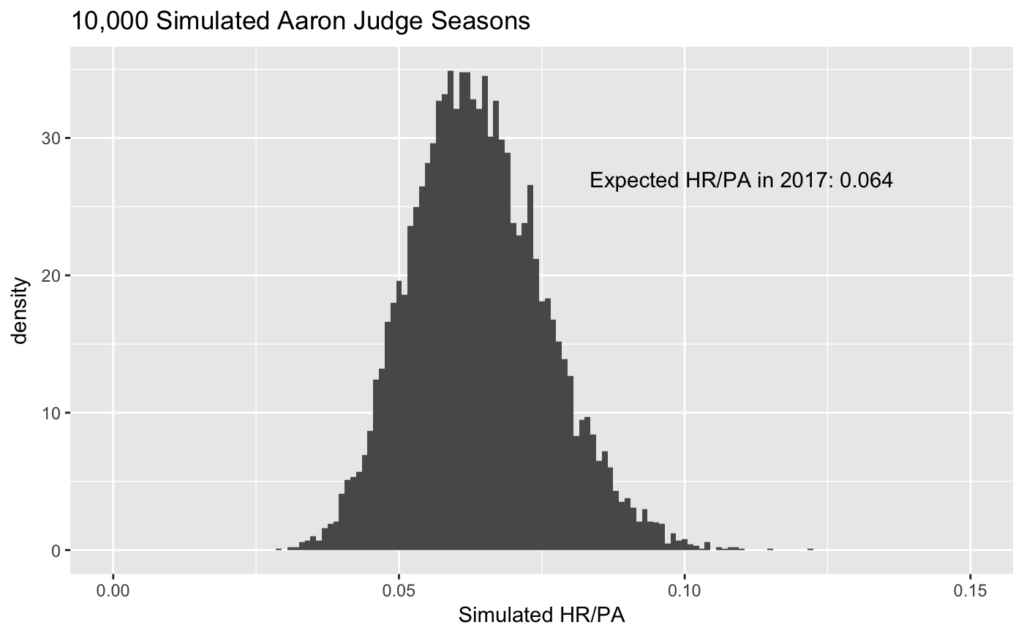
The graph shows Aaron Judge’s expected HR/PA talent, given our prior expectations and the evidence we have to this date, is .064 HR/PA. Going forward, this is the rate at which we’d expect him to crush baseballs over the fence. Note that this rate, while still excellent, is well below his current .081 HR/PA. But it’s more accurate: it combines what we know about Judge from observing him with the data that a true-talent .081 HR/PA season is extremely rare.
Okay, but How Many Home Runs Will He Hit?
“Ryan”, I hear you saying, “Tell me his final number already!” Thanks for being patient with me while I work out all this math. I promised you I’d tell you how many home runs Judge would hit. Let’s get to it; but first, just a bit more math! (Sorry.)
Let’s assume Judge gets 650 PA for the season, a typical full-time workload. Calculating Judge’s remaining HR total is as simple as:
- Finding out how many remaining PA he has.
- Multiplying this number by the HR/PA rate above, to get the home runs we expect him to hit.
- Adding the result from #2 to his current total of 23.
Step-by-step:
- 650 – 283 = 367 PA remaining.
- 367 * .064 = 23.4 HR remaining. We’ll round up to be nice and make it 24 HR.
- 23 + 24 = 47 expected HR this year.
47 HR is a nice high total. It would probably lead the major leagues, just like Mark Trumbo‘s 47 HR did last year. As a 25-year-old right-hander, this total would be the highest since Alex Rodriguez hit 52 in 2002. If you include Judge’s rookie status as well, 47 would be 12 higher than Ron Kittle‘s 35 homers in 1983. Setting a 34-year record is a nice achievement!
But 47 isn’t the “magic number” 50, and it’s not the 53 that pundits today will tell you he’s “on pace” for. Of course — Judge could hit 53. He could sustain his .081 HR/PA rate, which through 650 PA would give him another 30. Look at the graph of simulations above; .081 is within its bounds.
But how likely is it? In the 10,000 simulated seasons, 826 of them end with this HR/PA rate or higher. Therefore, assuming Judge gets 650 PA this year, we say he has a 8.26% chance of hitting 53 or more home runs. Those minuscule odds don’t give me a lot of faith in the pundits who forecast this total for him.
One More Thing
If you accept that Judge’s HR/PA rate going forward is .064 HR/PA, the following graph shows you how many PA he’d need to reach various HR totals:
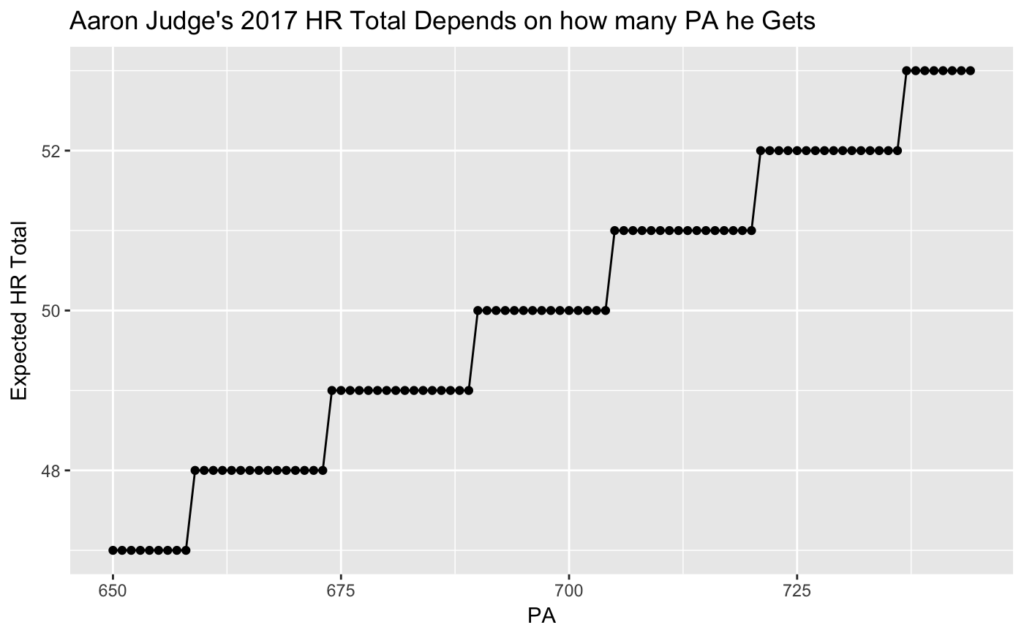
The more he’s on the field, the more home runs he’ll hit. At his true-talent rate we’d expect him to hit 50 HR around the time he reaches 690 PA. To hit 53 HR, he’ll need 737 PA, which seems unlikely. In the entire sample above, only four right-handed batters reached that threshold: fellow Yankee Derek Jeter in 2010 and 2012, George Springer in 2016 and Rickie Weeks in 2010. But hey, the AL East is competitive this year. As the Yankees drive for a postseason berth, they may want Judge on the field as much as possible.
When considering Aaron Judge’s expected year-end home run total, simply extrapolating forward is not enough. You must include the notion that what Judge is doing is rare and thus unlikely to continue. Including this information gives you a better understanding of Judge’s true talent, ensuring you can find Judge’s true home run “pace”.
Photo by Arturo Pardavila III.
3 comments
Comments are closed.